
Bitcoin price remains in a technical bear market this week after falling by double digits from the all-time high. BTC was trading at $66,800 on Sunday, and its fundamentals and technicals suggest that it has more downside to go in the foreseeable future.
Bitcoin price technical analysis points to a steep crash
The three-day timeframe chart shows that the BTC price has slumped in the past few months, falling from a high of $126,300 in October last year to the current $66,800.
A closer look shows that the coin is at a significant risk of further downside as it has formed a bearish flag pattern. This pattern started forming in January when it was trading at $90,000. It then plunged to a low of $60,393 in February, forming a flagpole.
Bitcoin has now formed a rising channel, which was part of the flag section. This pattern is notable as the coin formed a similar one between October last year and January this year.
Bitcoin has also formed a death cross pattern, which happens when the 50-day and 200-day Exponential Moving Averages (EMA) cross each other. It has also remained below the Supertrend and the Supertrend indicators.
Therefore, the coin will likely continue falling, potentially to the next key target being at $60,400, its lowest level in February this year. A move below that level will point to more downside, potentially to the psychological level at $50,000.
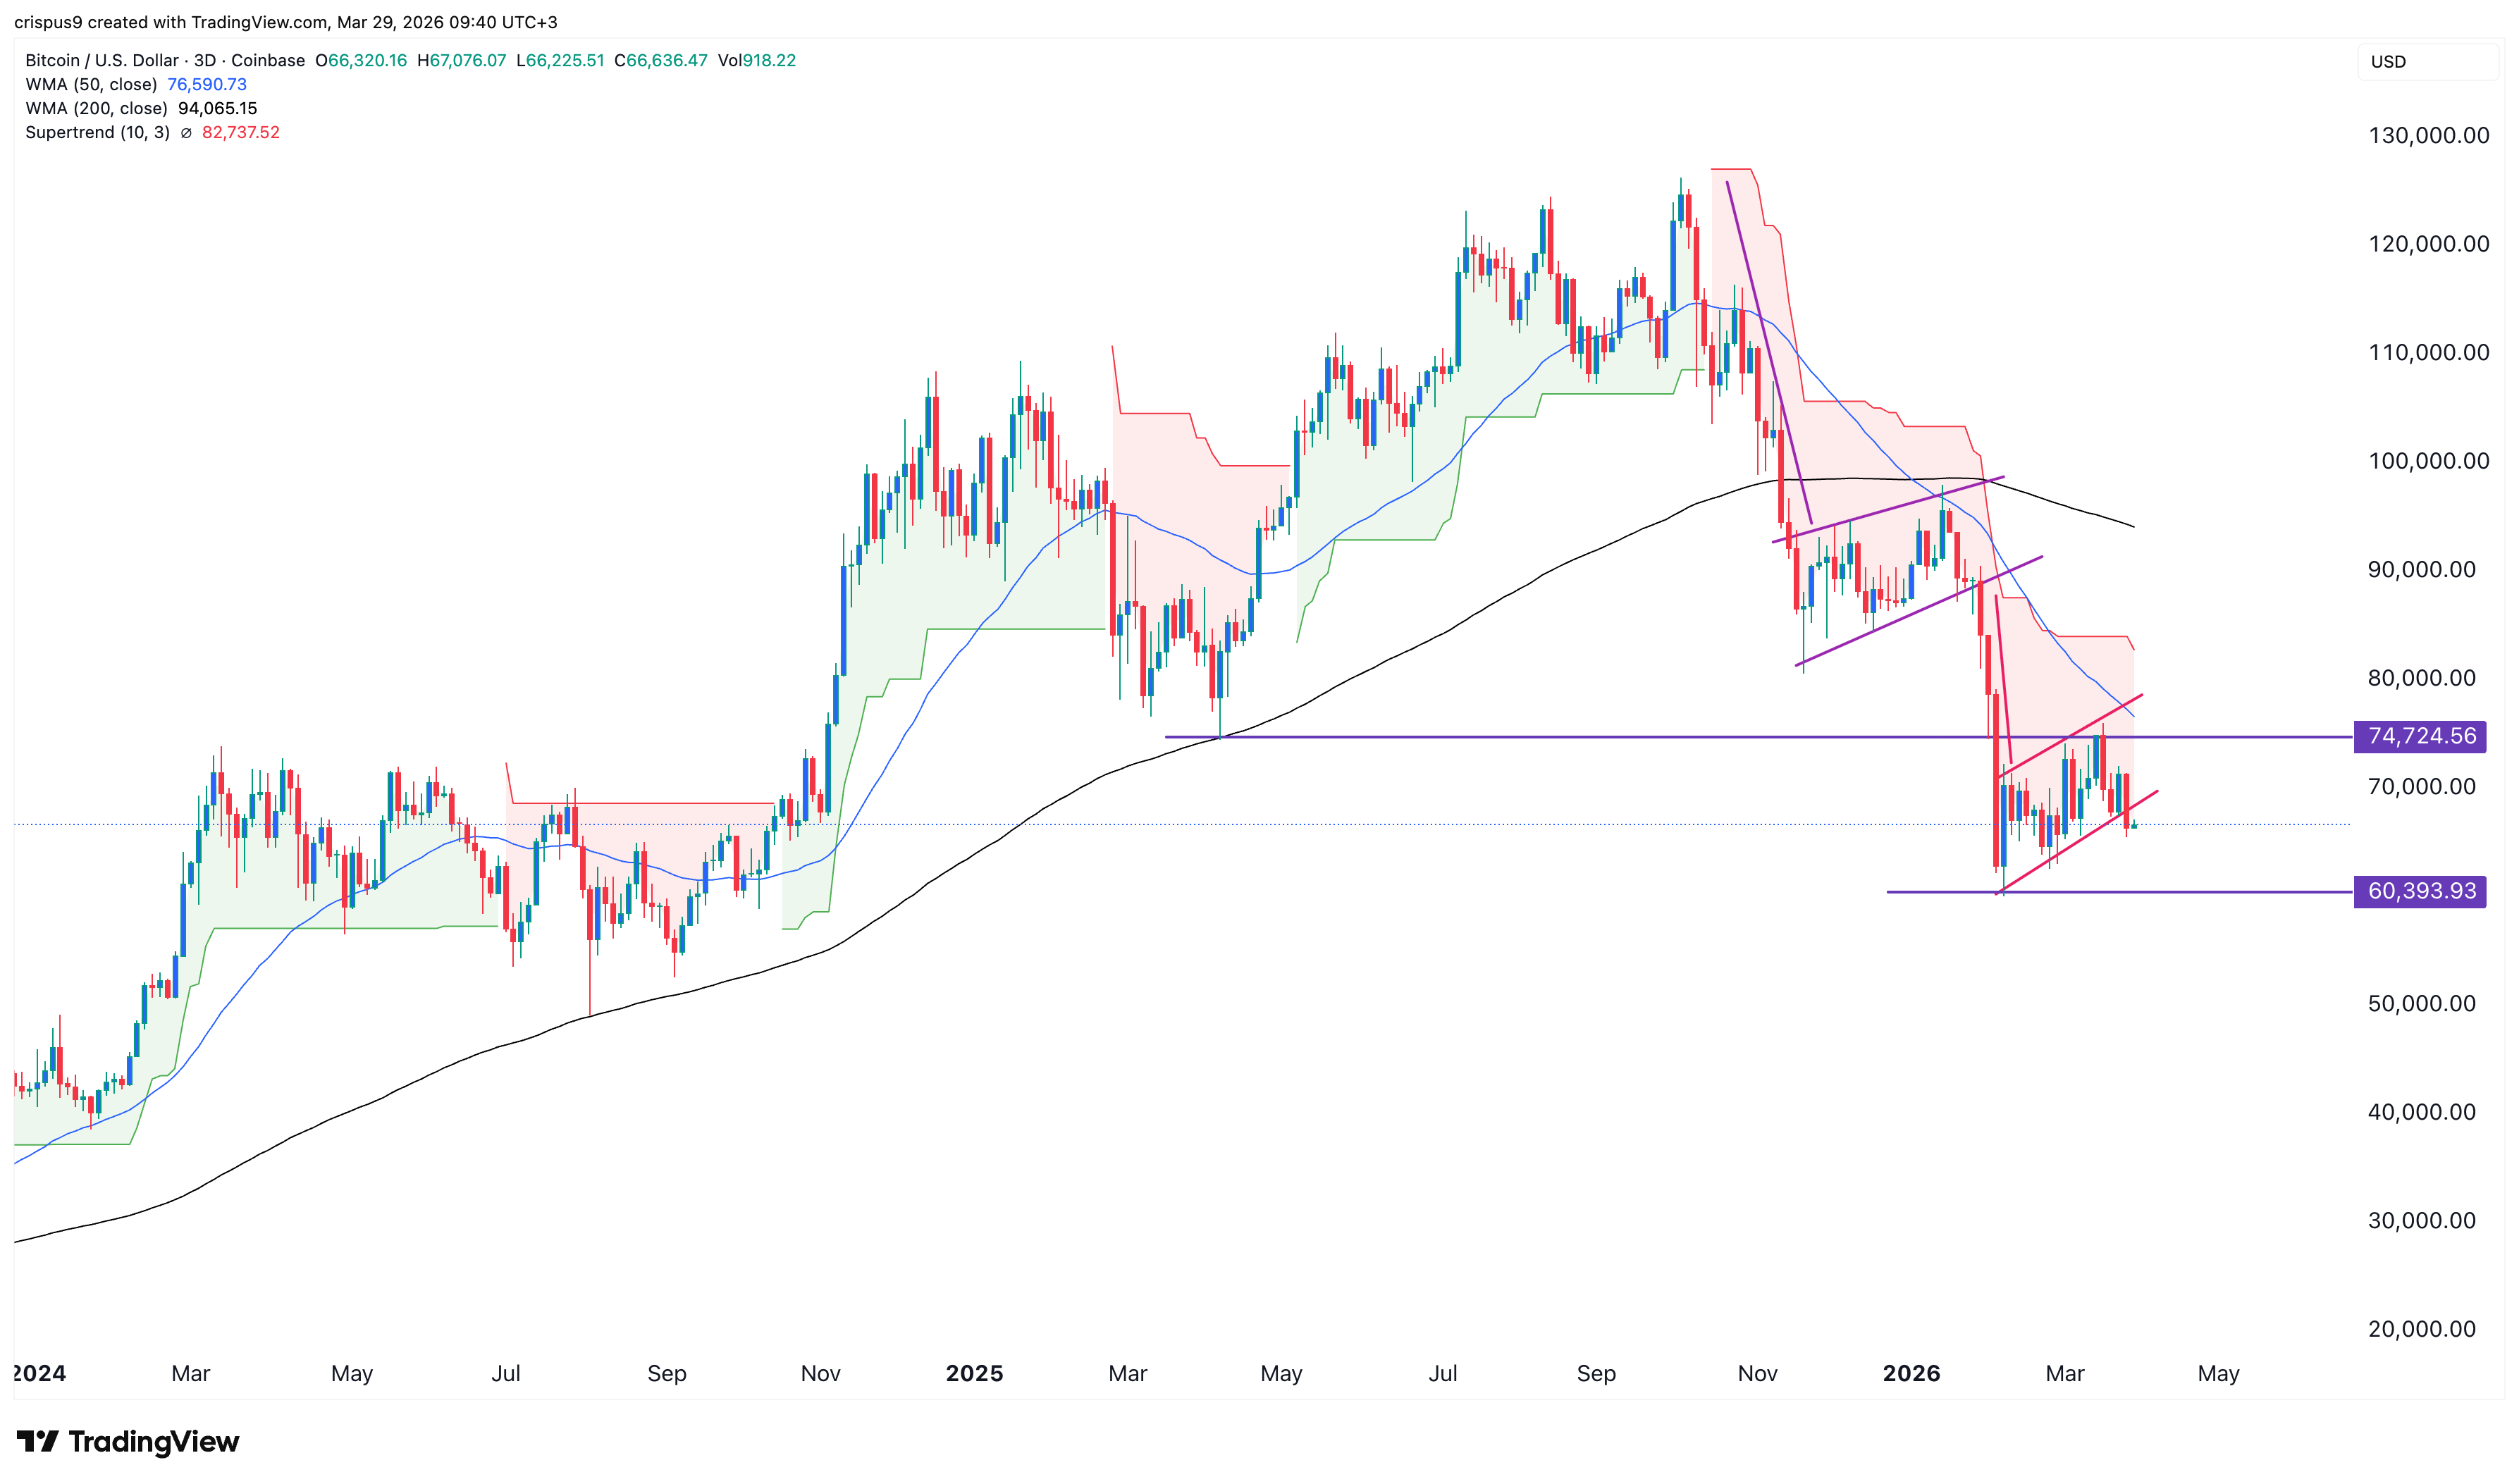
BTC price chart | Source: TradingView
Bitcoin at risk as Houthis join the war
BTC and other cryptocurrencies may be at risk as the Iran war escalates, with the Houthis joining the war and US military officials arriving in the Middle East.
President Donald Trump likely wants to occupy the crucial Kharg Island and then take control of the Strait of Hormuz, a route where 20% of crude oil passes through.
The implications of all this is that crude oil prices will continue rising in the coming weeks, leading to higher inflation in the United States. As a result, the Federal Reserve will likely maintain a hawkish tone, possibly by hiking interest rates.
Meanwhile, there are signs that American investors are capitulating and selling their coins. Data compiled by SoSoValue shows that spot Bitcoin ETFs shed over $296 million in assets last week, ending a four-week streak of inflows when these funds added over $2.2 billion.
Bitcoin’s futures open interest has continued growing in the past few weeks, a sign that demand is waning. The open interest has remained at $48 billion, where it has remained in the past few months. It has remained much lower than last year’s high of over $95 billion.
There are signs that Michael Saylor’s Strategy is the only major Digital Asset Treasury (DAT) company that is accumulating Bitcoin. The company bought 1,030 coins in the previous week, bringing the total holdings to 762,099.
Some Bitcoin treasury companies have started selling their holdings. For example, MARA Holdings sold over 15,000 coins last week and used the funds to reduce its debt to fund its pivot to the artificial intelligence industry.
The post Bitcoin price prediction: Alarming pattern forms as geopolitical risks rise appeared first on Invezz